SBMS4080


Introduction

The SBMS4080 is a Solarcharger for Lithium-based batteries and was successfully launched as crowdfunding-campaign at Kickstarter in Summer 2014 by Dacian, aka Electrodacus.


The Number 4080 means, that the Input-Amperage from Solar-panels (or other powersources) can be up to 40 Amps. The maximum output is in the range of up to 80 Amps.

The device is sufficient to be the battery-management-system (BMS) of a solar OffGrid-application based on a battery-bank of up to 8 LiFePO4-cells at 24V (or other Lithium-cells like LiCoO2-cells). According to the special demands of Lithium cells this means, that it has also a balancer-functionality which is crucial to ensure a maximum of lifecycles of the cells.


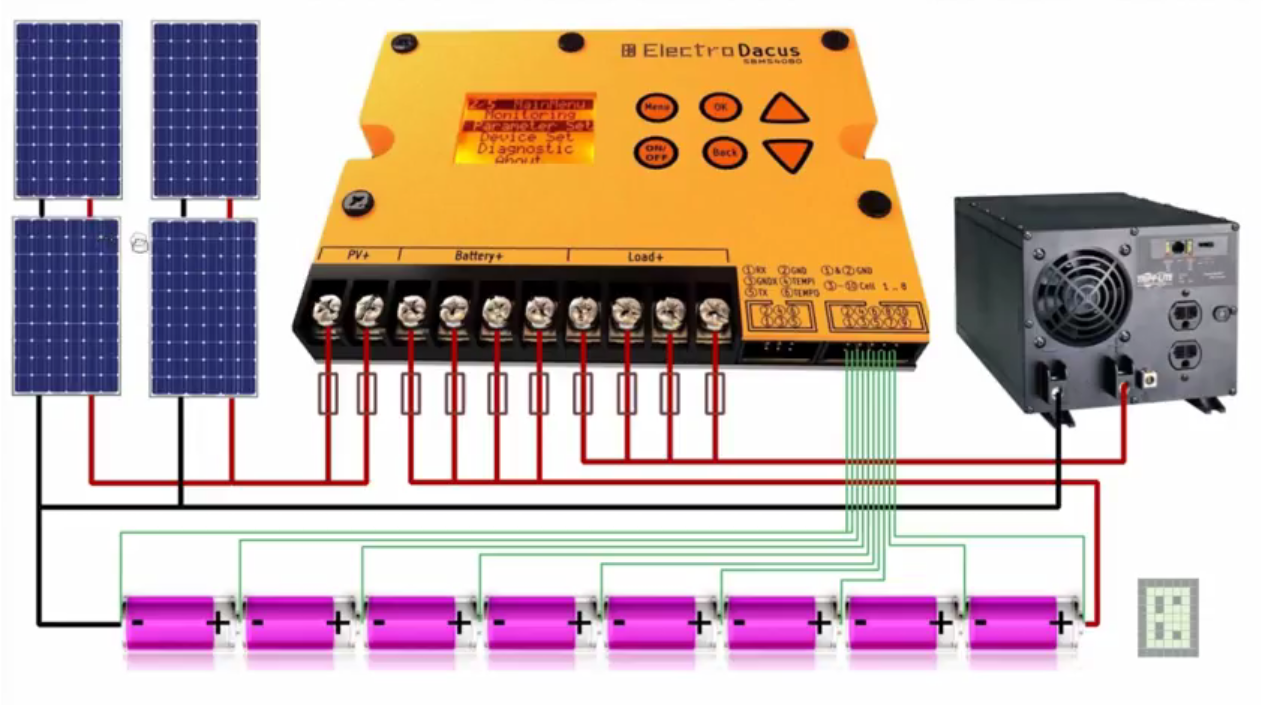
Setup with Cabling and Connections

System dimensioning

Within a typical application the size of the solarpanels can be up to 800Wp with a capacity of the battery-bank at 2,4 KWh (more or less is also possible) with 100Ah-cells, connected serial to 24V.

24V-configuration


Smaller sizes as entry-configuration are also possible, but a minimum of 3 cells is required to keep the SBMS itself running.

The size of the solar-panels should be corresponding with the capacity of the cells.

In the manufacturers datasheets of your cells are detailed information about the maximum charge-current (as well as maximum load current) and there maybe differences between different products, but as a rule of thumb it is about 1 C at LiFePo4 cells, meaning, the max.charge current for a 60Ah cell can be as much as 60A for fast charging. But be aware that this shortens the numbers of lifecycles.

A good value for ensuring a long lifetime is at about 0.3 C. You might therefore charge your 60Ah-cell with about 20 A output from the solar-panels. So you can take for example 8 solarpanels of 100W each and connect them in 4s2P-Configuration, which means two strings in parallel with each one consisting of 4 panels in series. The two strings will deliver 24 Volts Output at 20 A.


Cabling

If you have 8 cells, they will have to be connected like in the above Picture. Pin No.1 and No.2 of the Balancer-Port are connected to GND, that is the minus-pol of the battery-bank. The 8 balancer-cables are connected to the Pins No.3 to No.10, in a descending order from left to right, or more precisely from thefirst balancer-cable between cell1 and cell2, towards the direction of the plus-pol of the bank at cell10.

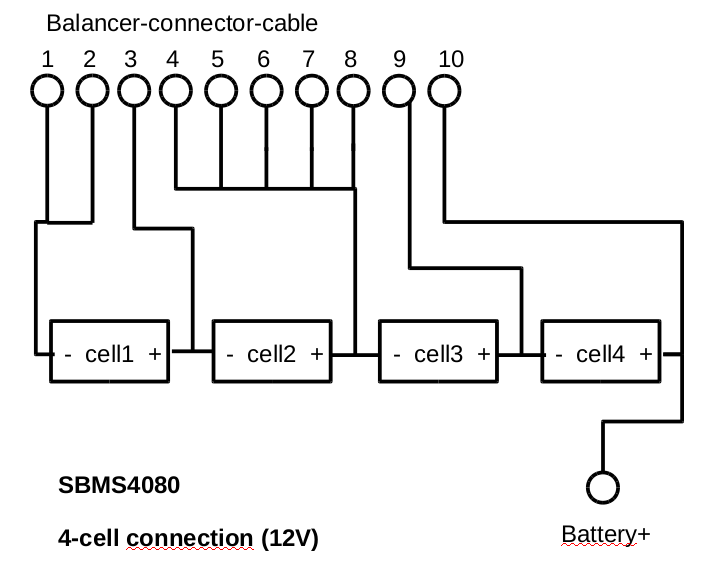
If you have less than 8 cells you have to care for a individual pin-connection scheme, depending on the number of cells. Here is an example for a 12V-System consisting of 4 cells. The balancer-cables must be connected in a specific matter, which is denoted in the picture below.

12V-configuration


Pin No.1 and No.2 are as usual connected to battery-banks minus pol, then the first two balancer cables (from left to right) are connected to Pin No.3 and No.4, but then the other balancer cables are connected to Pin No.9 and No.10. To keep the 4 loose ends of the balancer cable from floating, they were tied upt to Pin No.4 additionally.


Below you can see an example of the 12V configuration which is done as a testing-setup with small 10Ah-cells. Be aware that especially for bigger cells its important to use appropriate terminal-connectors, which are usually made of metal-plates which can become screwed on the cell-terminals. A tight interconnection amongst them and also the balancer cables ensures more precise sensor-measuring of the individual cells, so you want to keep connectors-resistance possibly small.


Other configurations
Here are the special connection patterns of the balancer-cable for other configurations, eg. with 3, 5, 6 or 7 cells. The battery-bank minus-pol, meaning the minus-pol of cell1 is always connected to Pin No.1 and No.2 of the balancer-cable. Then the plus-pole of a given cell_x is connected like:

3 cells:
cell1+ ==> Pin No. 3 (of the balancer cable)
cell2+ ==> Pin No. 4
cell3+ ==> Pin No. 10

5 cells:
cell1+ ==> Pin No. 3
cell2+ ==> Pin No. 4
cell3+ ==> Pin No. 5
cell4+ ==> Pin No. 9
cell5+ ==> Pin No. 10

6 cells:
cell1+ ==> Pin No. 3
cell2+ ==> Pin No. 4
cell3+ ==> Pin No. 5
cell4+ ==> Pin No. 8
cell5+ ==> Pin No. 9
cell6+ ==> Pin No. 10

7 cells:
cell1+ ==> Pin No. 3
cell2+ ==> Pin No. 4
cell3+ ==> Pin No. 5
cell4+ ==> Pin No. 6
cell5+ ==> Pin No. 8
cell6+ ==> Pin No. 9
cell7+ ==> Pin No. 10

If you edit the cell-number in the parameter-menu, you can watch at left beside the value a kind of scrolling help occurs and shows you the special connection pattern at different cell-numbers.

Connecting

When assembling your system you have to make the connections in a special order.

You have at first to only connect the Battery+ terminal to you battery positive lead and then insert the 10 pin connector. Now the SBMS4080 should be lit and starting with a calibration process which must be done without Input Power (from solar-panels or another power-supply) and the Load beeing connected.

Then go into the Parameter-Menu and change the parameters according to your battery type and store the changes. For storing you must travel down the parameters list and you will find then at the bottom a "Store"-option !

Now remove the 10 pin connector for 5 seconds and reinsert to reset and take the new parameters in to account. Afterwards you can connect the Load+ and PV+. Here the Load-Button may be helpful which switches the Load- and the PV-connections to on and off, meaning, you can connect the wires in off-mode and then switch it on with the button.


The User-Interface

The SBMS4080 User-Interface (Video by Dacian explaining the UI)

Parameter-Menu

In the parameter-menu are some predefined setups for different battery-types, like LiFePo4, LiCoO2 (sometimes also called "Li-Ion") and Supercapacitors (for testing purposes). You can reach them by the parameter "CellType". The "horizontal scrolling help" will indicate, which types are available.

Depending on which of these presets you will choose, the default-values of the subsequent parameters may change also according to it.

In case of editing different cell-numbers (than 8 cells) in the parameter "Nr-Cells" you should also change the setting for the parameter "Capacity". Be aware, that the real capacity of the cell may be a bit lower then the cells nominal capacity. So if you are later adjusting this parameter, if the system is in use and you have measured the true capacity, you can reach a better and more precise value of the State-of-Charge estimation from the system.

Another parameter to change then also is the "OverIChg", which denotes the allowed maximum charge current before disconnecting the powersource/PV for OverCurrent protection.

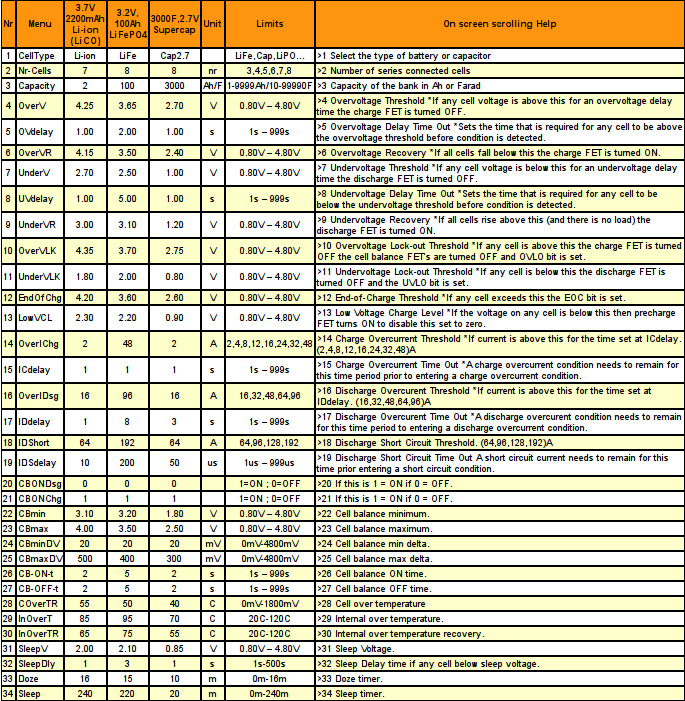
There are a lot (35) of other parameters for certain thresholds or dealing with values needed for the balancing. A good overview of default values for different battery-types is given in the following table:


Monitoring and regular use

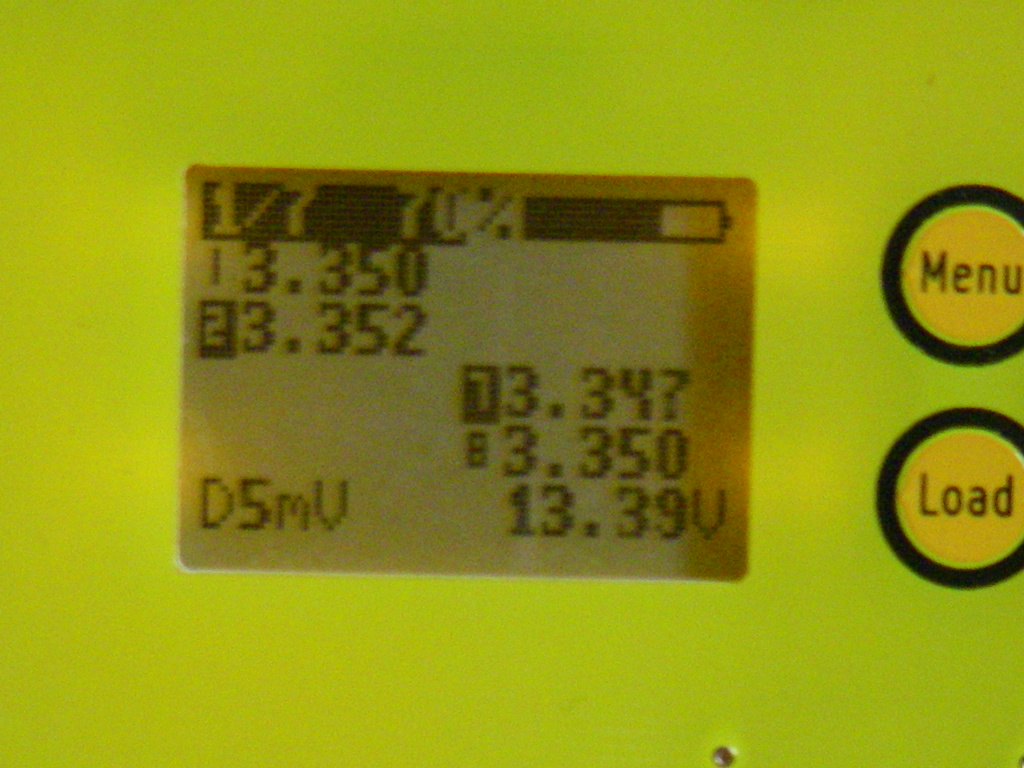
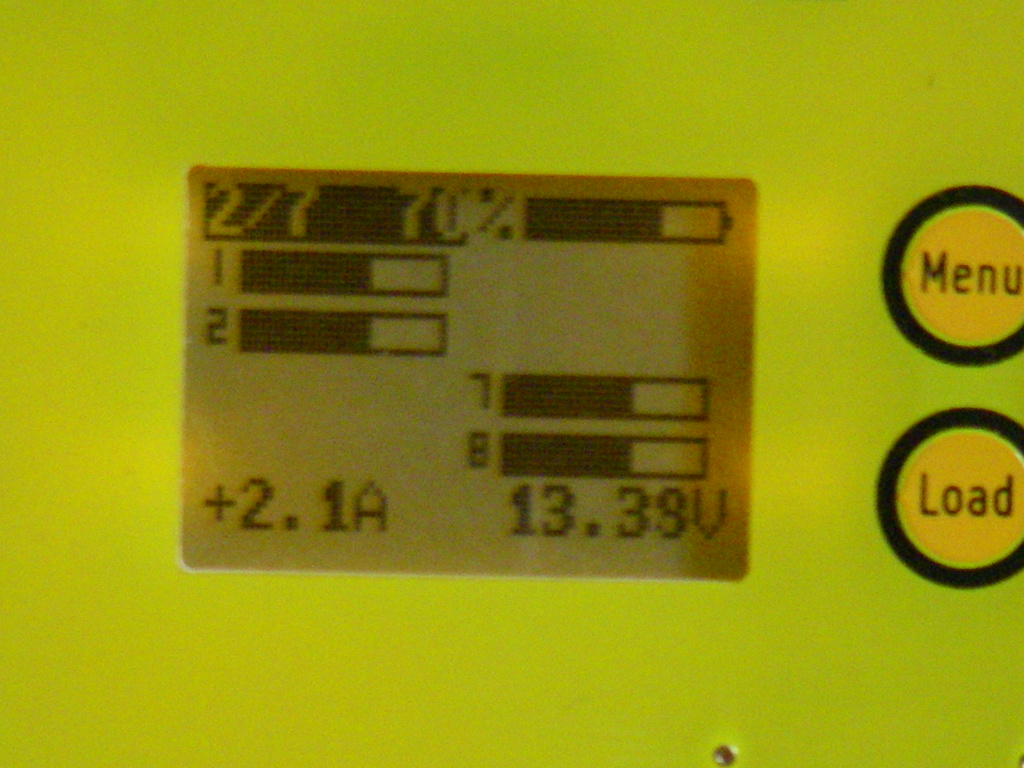
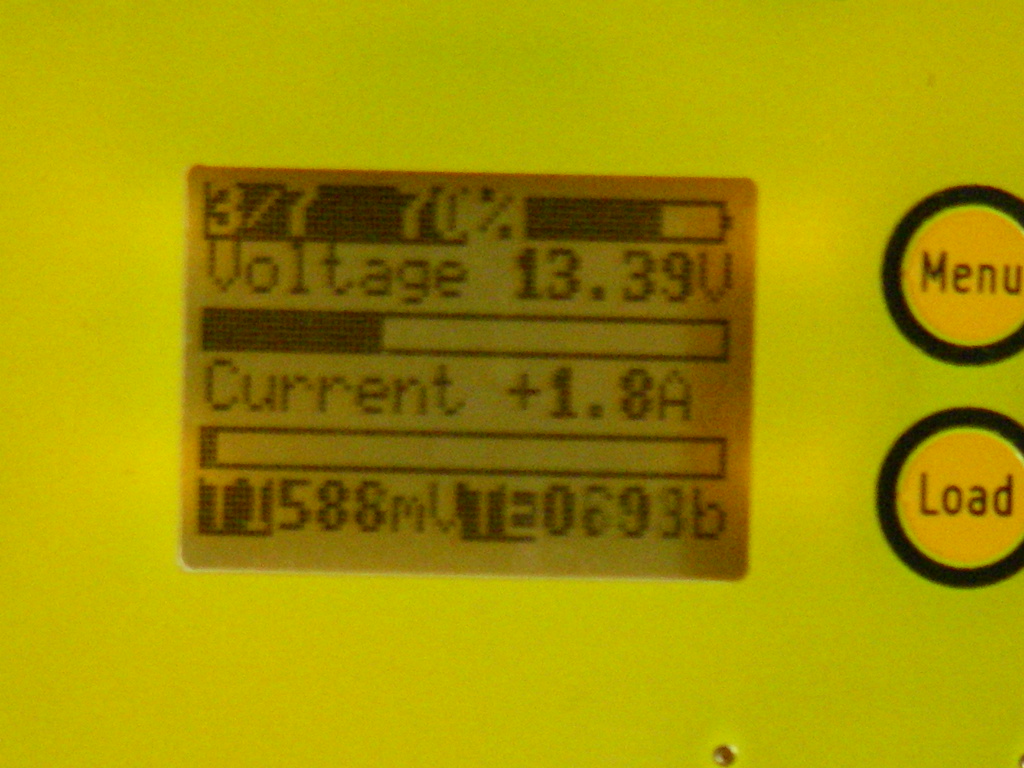
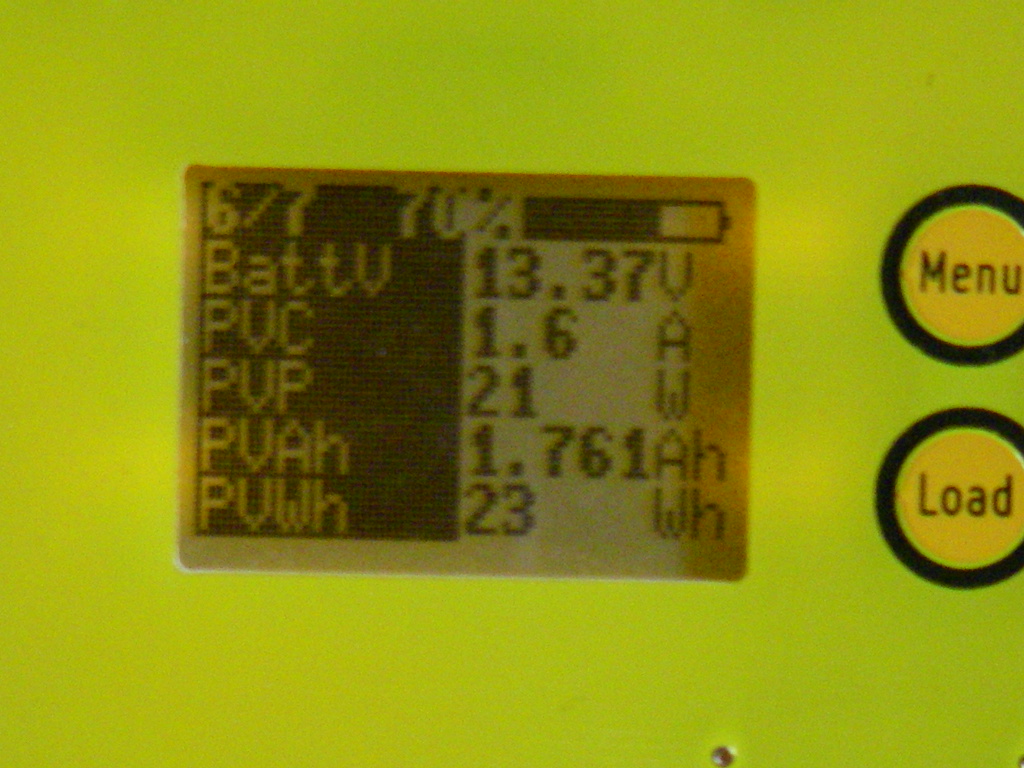
Witwhin the Monitoring-menu you can navigate with the up- and -down-buttons and therefore choose between 7 different monitor-modes in ergonomic views. In which mode of these 7 you are is described in the left upper corner, like "1/7" (page one of seven). In the middle of the first row occurs the "SOC" = State of Charge, which shows, to which percentage of capacity the battery is still full.

Cell Monitor

This Overview shows you the voltage of each single cell, which is important to get an idea about the health of the whole battery-bank, or if a failure of a single cell occurs. This is also helpful to see the effect of the balancing. Normaly the cells are not perfectly equal, but they should be as next to each other as possible to ensure a maximum of lifecycles.

The trailing index-numbers of the two cells with the highest and the lowest voltage become black inverted and in the left lower corner is shown the difference between them.

In the right lower corner you see the summed up total voltage of all cells respectively the whole battery-bank.


The Monitor-Page No.2 shows also all the single cells, but in a graphical manner. It also shows the charging current in the left lower corner.


Voltage-Current Monitor

This Viewmode shows the overall battery-voltage and the charge-current in a graphical diagram. The row at the bottom shows values from a temperature sensor. Especially when you are using with LiCoO2-cells you want to keep aneye on that ;)


Solar Input Monitor

This monitor shows the Powerinput from the Solarpanels (or from another, constant powersource). At the top there is shown the battery-bank-voltage (BattV) and below the Photovoltaic Input Current (PVC) as is provided by the panel. Then comes the calculated Input Power (PVP) which will be calculated by the over the time accumulated amount of current as incoming Amp-hours (PVAh) and below the accumulated Watt-hours (PVWh). The Accumulations starts with each System-Reset at Zero.


Battery Charging Monitor

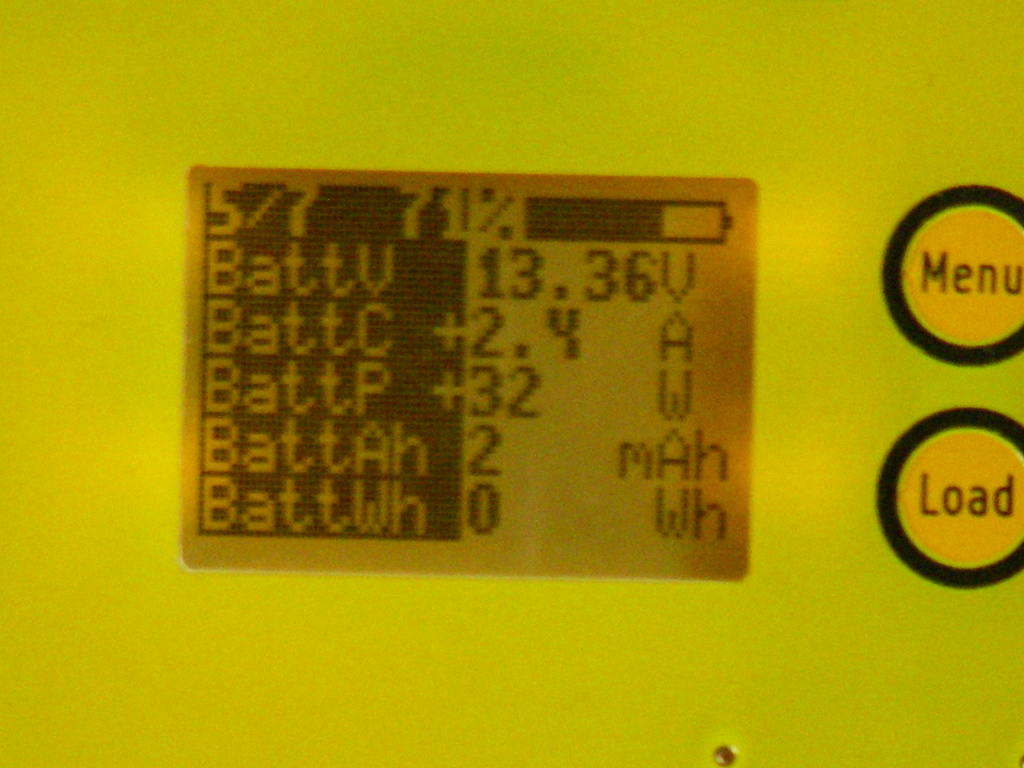
Here you can watch the battery-input while charging. At the top there is shown the battery-bank-voltage (BattV) and below the Battery-Input Current (BattC), which can be higher, than the Input-Current from the solarpanel, because of conversion into an appropriate charging-voltage. Then comes the calculated Input Power (BattP) which will be calculated from the amount of charge-current which is accumulated over the time and shown as AMp-hours (BattAh) and below the accumulated Watt-hours (BattWh). The Accumulations starts with each System-Reset at Zero.


Load Monitor

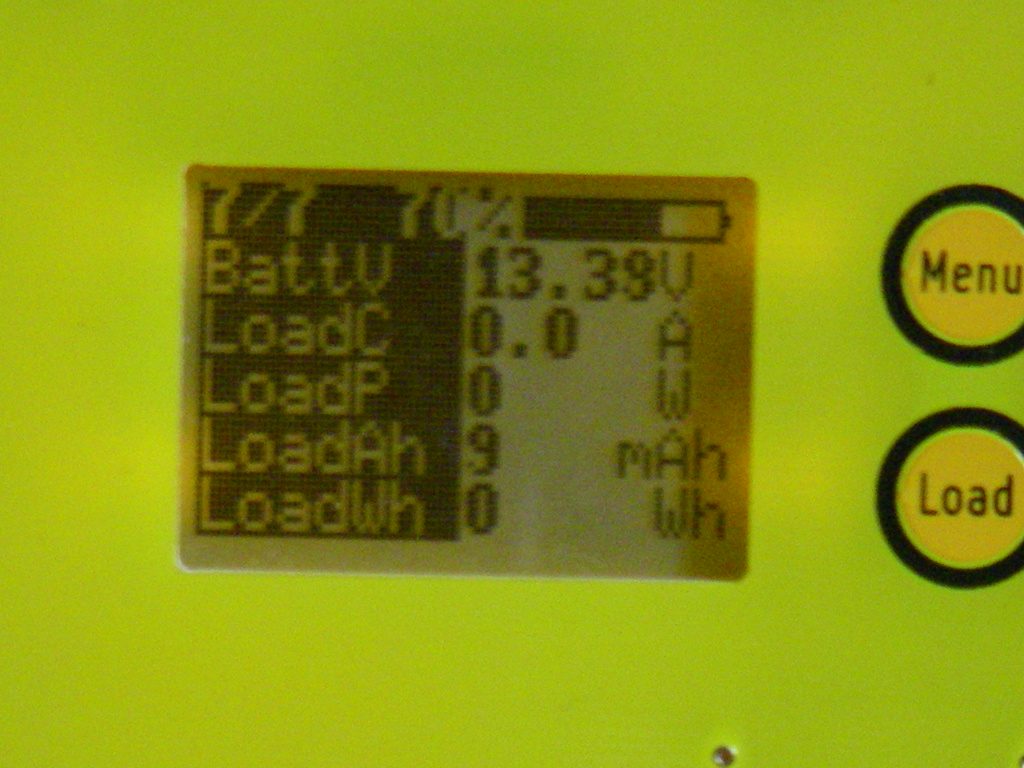
This monitor shows the side of the load. It shows below the Battery-Voltage the current that the load consumes in this moment (LoadC) and based on that the resulting power-consumption. Both became accumulated over the time and be shown as consumed Amp-hours (LoadAh) and consumed Watt-hours (LoadWh). The Accumulations starts with each System-Reset at Zero. (In the screenshot below the Load was just switched off.)


Flag Monitor

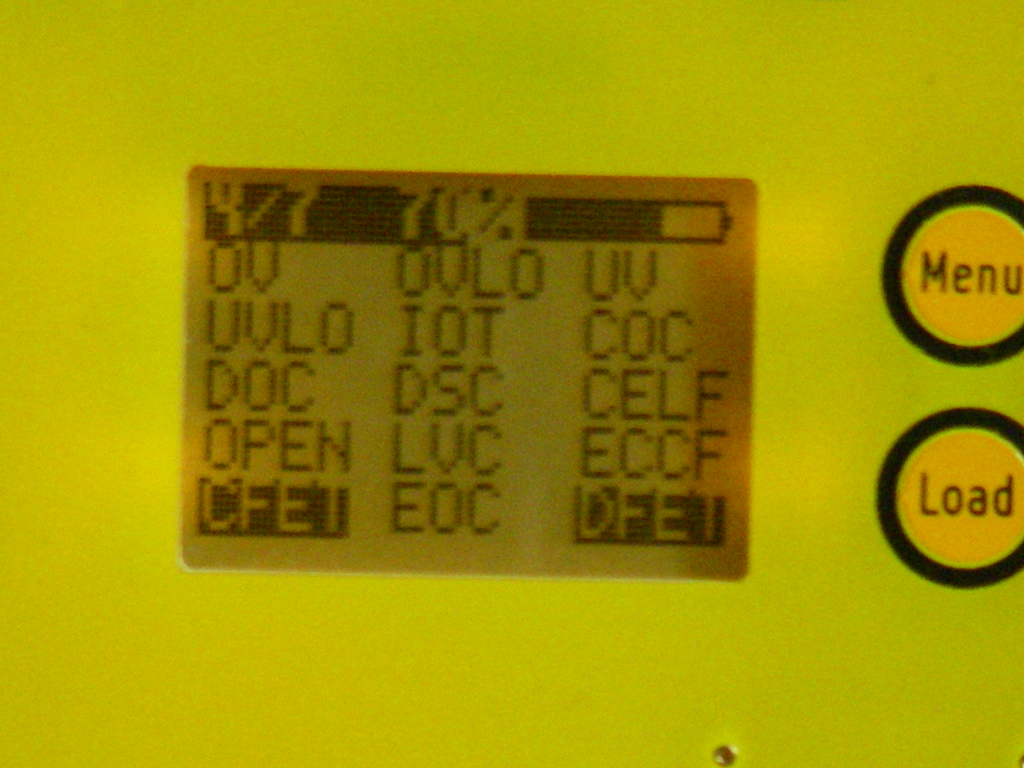
The Flag Monitor gives an status-overview of the system-flags in that moment. Theses flags can become activated in certain runtime- or error-conditions that may occur, like Over- and Under-Voltage or End-of-charge (OV, UV, EOC). These Flags are related to some of the parameters that you can define in the parameter-menu.


Hardware and Firmware

Dacian video, explaining the SBMS4080 working principle and design considerations, like which parts are used

Dacian video, explaining the SBMS4080 Hardware

Specification


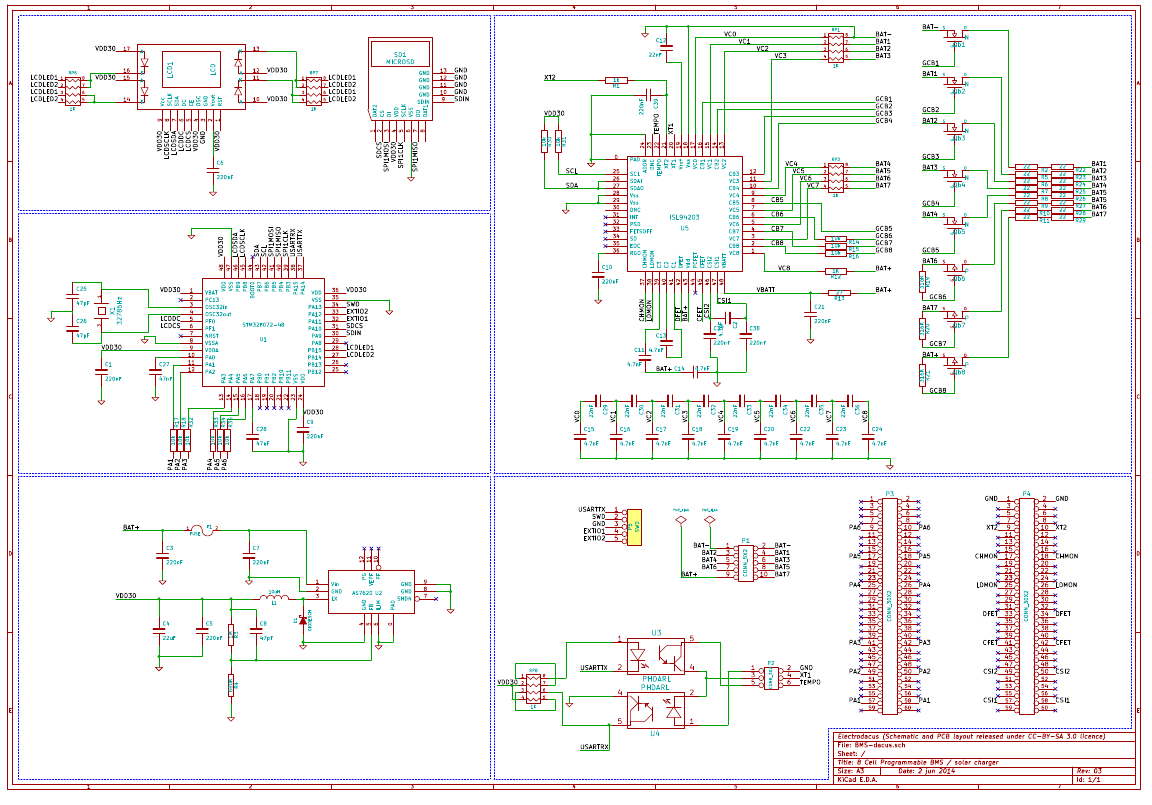
Pcb-schematics

Version V.03c


SBMS4080-main.pdf

SBMS4080-power.pdf

SBMS4080-front.pdf


Firmware sources

Version V.11c

SBMS4080_HWv03c_SWv11c.zip (Version V.11c)


FAQ

Troubleshooting

Problem: I2C-Error at the beginning of the startup
Solution: battery+ must be connected. It can also occur in configurations with less than 8 cells are connected and the loose, not needed balancer wires are free floating. Just tie them up to one of the other ports.

Problem: LCD-contrast is fading or nearly gone.
Solution: Apply a carefull slight pressure just above the display, where the LCD's zebra-connector is located underneath. In some rare cases the zebra connector's contact with the gold pads is less reliable, but a little pressure should fix the problem. Otherwise you can replace the LCD of type "Nokia 5110", they are extremely inexpensive. Next Version of the SBMS will have another LCD with graphics.

Notes

- Constant Current Charging:
SBMS will only do constant current charging since that ensure the max battery life important is stationary energy storage application. The second part of the charging the ConstantVoltage part can give additional charge capacity in case of LiFePO4 only constant current will charge the battery to about 95% level and LiCoO2 to about 85%.
Since Laptops and Cellphones manufacturers are much more interested in energy density the need those 15% additional on LiCoO2 much more than they need better life-cycle.
A LiCoO2 charged with only constant current to 85% will last 2x more charge cycles and even if they are 85% that is still over 70% more energy stored during the life time of the battery. But weight of cellphones and Laptops is more important than battery life since you usually upgrade the Laptop or phone in two to three years and the battery will last that long even charged at 100%

- Balancing:
The cell balancing is only done during charge, discharge or both based on the parameter settings but it will never be done without a PV or a load with at least 300 to 500mA of current.

- other important things to tell about the SBMS4080

Hardware compatibility and Part-Suppliers

- recommendations: which cells are the best in terms of quality and pricing
- references: which hardware is already tested and in use by SBMS4080 users


LiFePo4-cells:
Manufacturer DS Cell Ah Lifecycles Supplier Dimensions Wheight Energy Density Inner Resistance
GBS LFMP100AH 100 1500 / DOD 100%
3000 / DOD 80%
ElitePowerSolutions, German Supplier 235x127x65mm 2,9 Kg 110 Wh/Kg 2 mOhm
Wina IFP2265106 10 1000 / DOD 100%
2000 / DOD 80%
I-Tecc, German Supplier 106x65x22mm 0,3 Kg 107 Wh/Kg 5 - 12 mOhm
Winston WB-LYP100AH 100 1000 / DOD 100%
2000 / DOD 80%
I-Tecc, German Supplier 220x143x67mm 3,5 Kg 91,4 Wh/Kg ??? mOhm
Winston WB-LYP100AHA
( Typ B or A)
100 1000 / DOD 100%
5000 / DOD 80%
Winston 218x178x62mm 3,6 Kg 88,9 Wh/Kg 0,45 mOhm


Outlooks

Planing the next version of the SBMS.
For those interested there will be another Kickstarter campaign soon and that will be for an upgraded version of the SBMS.
Some off the upgrades include:

-- double the power handling from 3kW to 6kW so 100A for both charging and discharging 120A overcurrent protection with larger connectors that can take #2 AWG wire or 35mm2 while keeping the max TDP at the same 22W and similar size.

-- a higher resolution 320x240 color LCD.

-- dedicated 24bit ADC for more precise current measurement.

-- Bluetooth 4.1 for remote view and data logging.


Links

Dacians Homepage

Dacians youtube-channel

Dacians google+-channel

The SBMS4080 User-Interface (Video by Dacian explaining the UI)

Martin Lortons SBMS4080 review on youtube-video

Links to the IC's manufacturer datasheets

Intersil ISL94203 3-to-8 Cell Li-ion Battery Pack Monitor

About ARM Cortex-M0 processor in common

This ARM Cortex-M0 processor: STM32F072xx

Maxim Integrated - MAX4080 76V, High-Side, Current-Sense Amplifiers with Voltage Output

Austriamicrosystems - 500mA Hysteretic High Voltage Step-Down Converter with Dual Power Monitor for the self-power-consumption of the SBMS4080

International Rectifier - IRF7749 The Power-MOSFET, 2 of them are used for charging

Infineon IPT007N06N The Load Mosfet for discharging


Interfacing, data-acquisition and logging-diagrams


Serial communication by the TX/RX-port


The serial Interface of the SBMS is the 6-Pin Service-Connector at the left side of the Balancer-Port. Here the lower three Pins 1, 3 and 5 are connected with RX, GND and TX.

They can be easily connected with a FTDI-Adapter-Kabel, which connects a serial Port to the USB-Device of a Linux-PC. Under Linux the data can be retrieved from a serial tty-device driver like /dev/ttyUSB0 or /dev/ACM0, which means you can simply use a regular Arduino IDE as a Terminal, just open its serial Monitor, and you can see the data flow from the SBMS.

In the settings-Menu of the SBMS you can adjust under DeviseSet->USART the serial Baud-Rate and the Interval, at which the SBMS should commit its recent measured Data, eg. each 1s.

The Baudrate should be set according to the default Baudrate of the Arduino-IDE at 9600 Baud. If you have a very noisy cable it can be helpful to use a lower Baudrate, eg. 4800 or 2400 Baud.

As soon as you see the data flowing in the IDEs serial monitor you know that the physical data connection ist established and works well.


Data Logging und Visualization with libreoffice


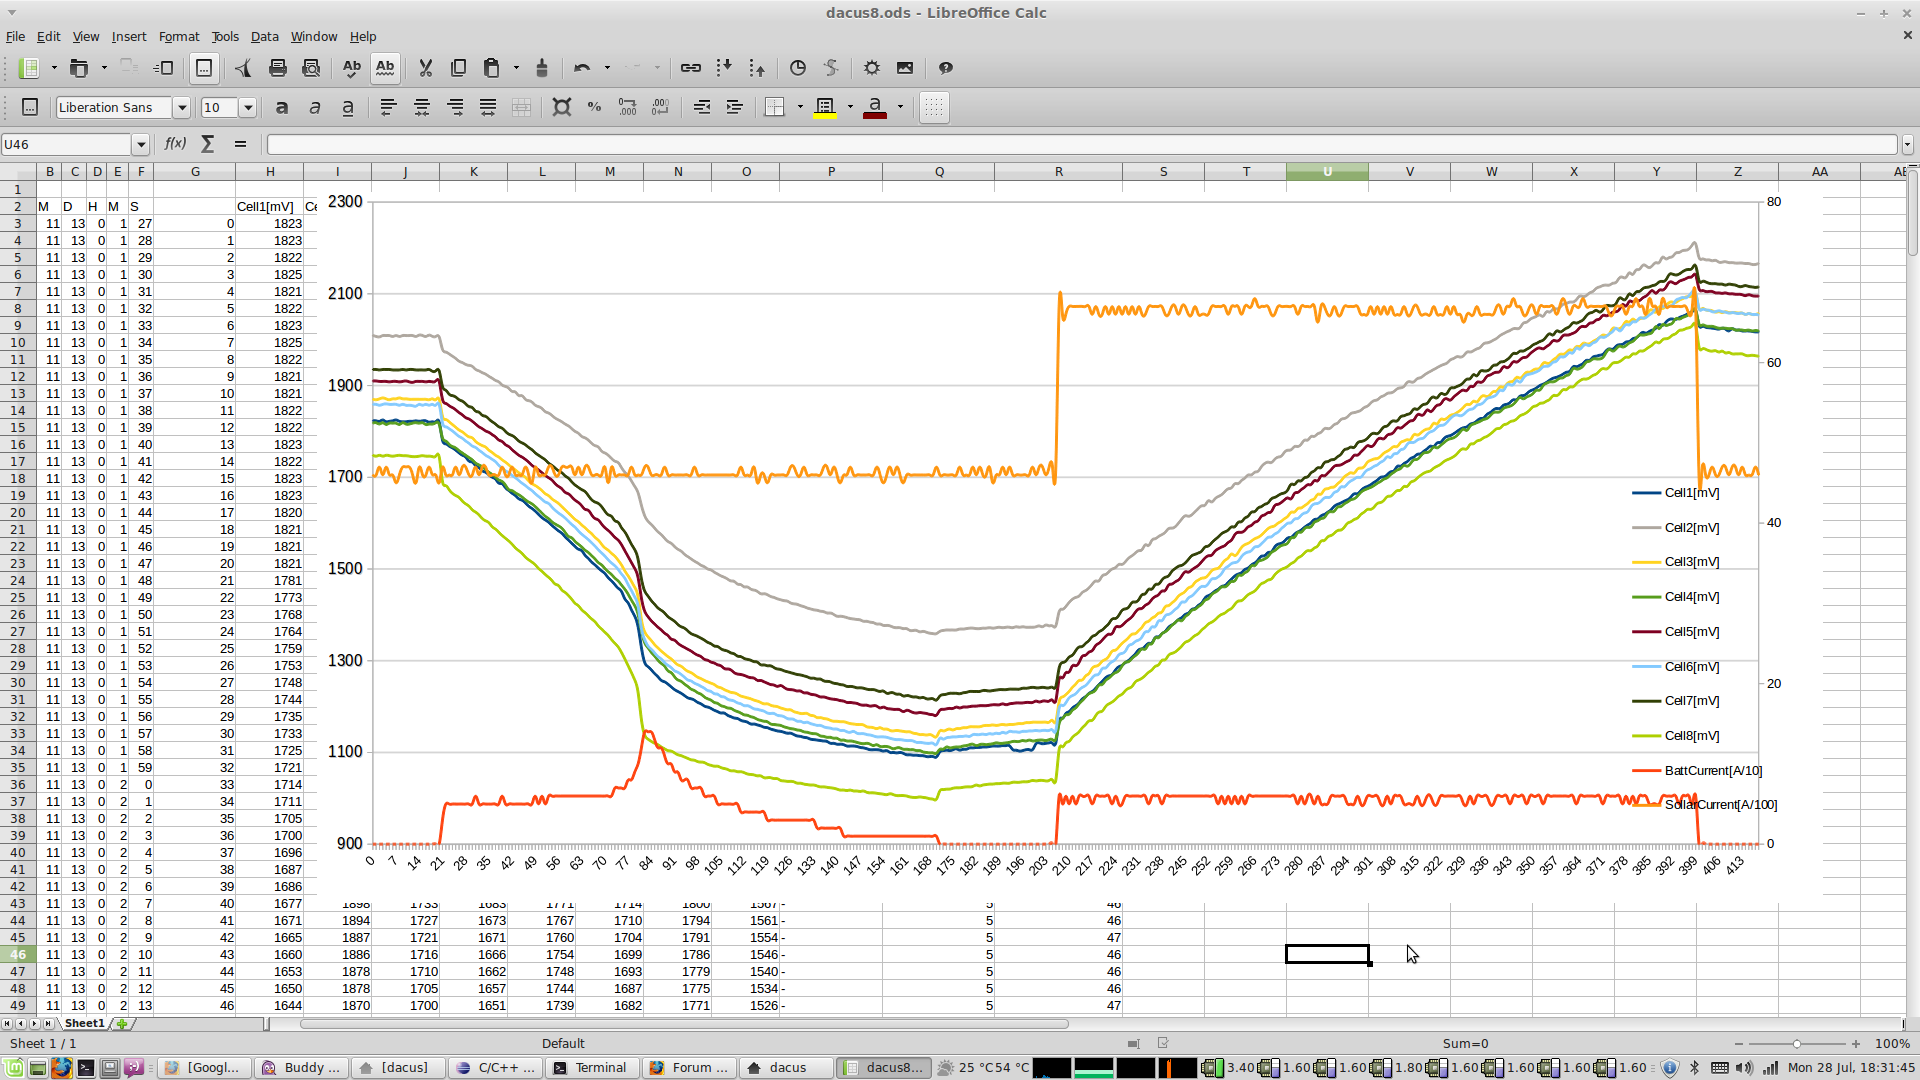
This an easy method which Dacian uses. He just set the serial interface with stty and then save the data in a csv file directly and build his graphs in Libre Office Calc. That is how the following 7 day energy production and consumption graph was done.


Data Logging und Visualization with rrdtool

Here is a short description on how to install and setup a sampling-test-application , which you can customize to your individual needs (e.g., the number of sensors and which of them are shown together in a diagramm)

This method is more complex to set up, but offers a continuos flow and data-update, according to the sample-transmit frequency of usually about one data-set per minute.


Logging-Diagramm examples of typical SBMS behaviour


Low Voltage Cutoff (LVC)


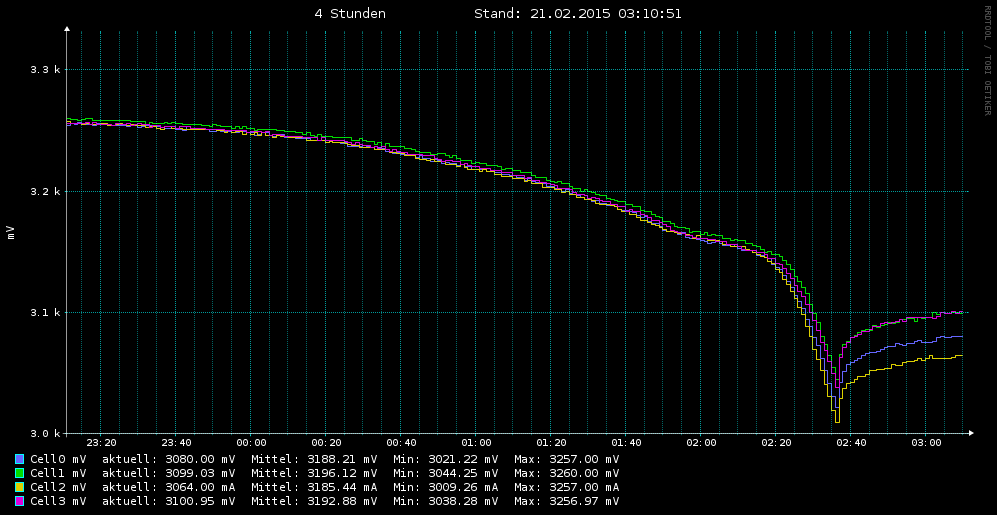
In this sample from the monitoring of 4 single cells, we can see a typical LVC, following a period of continuously discharging the batteries. As soon, as one single cell reaches the default low-threshold of 3.00 V the discharging FET will be switched off, which happened in this case at 02:38. afterwards the batteries are still decoupled from the load and therefore slowly recovering.

Interestingly there is a spread between each single cell, which can be considered as beeing normal in this case.

If the spread would become bigger, it would be considered as the so called "drift", which is unwanted, because it lowers the capacity of the whole pack and can damage the cells in the long run.

To overcome this problem, a good BMS contains a balancer, which equals the cells inner state / voltage among each other. So, in the best case, you should never notify a significant drift.

However, this visualization helps you, to control visually, whether the BMS is working properly and is therefore an important tool for the ongoing development of the SBMS funcionality.


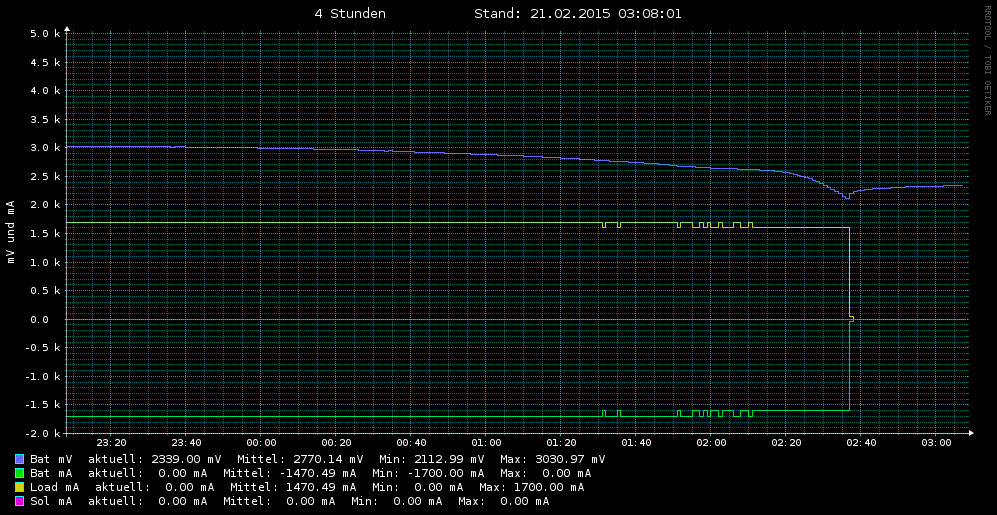
Here is a sample of the whole accu-pack total voltage (the blue line), which has an Offset of minus ten for ergonomical reasons (if you read 3.5 at the left scale, it means 3.5V + 10V = 13.5V). The yellow line shows the amperage of the load/consumer at about 1.6A, which is mirrored by the green line, depicting the battery amperage. It is negativ, because this is discharging-situation, so the current runs of from the battery. Meanwhile no external power runs into the battery so the purple line which stands for the solar input current is at zero.


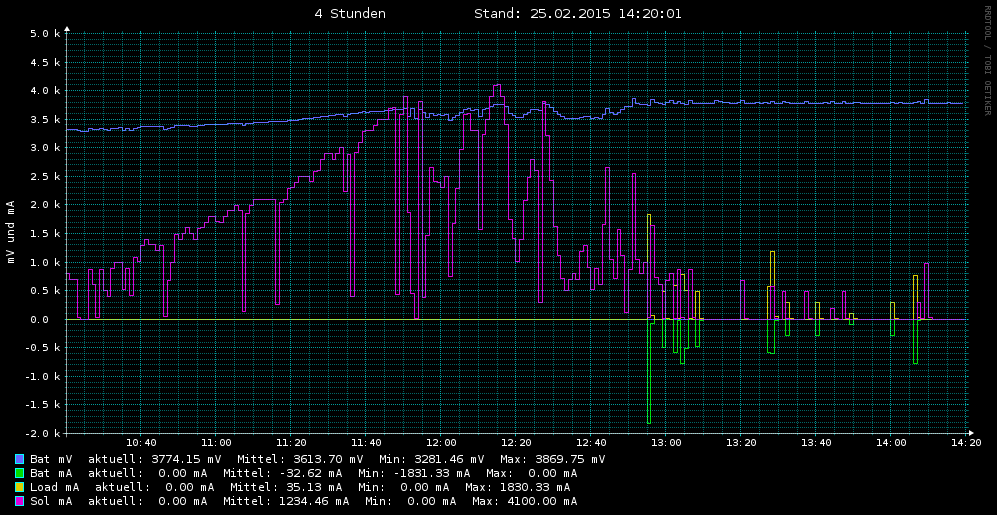
Then the whole story developed like this: After the LVC the cells recovered a little and stayed at that level during the night (meaning without external power input). When the day began, at about 9:00 the voltage of the single-cells (and total voltage as well) starts rising up to a certain level, until about 12:00 there is here and there a very small amount of sun with about 1A input-current, which then suddenly peaks at 14:00 with up to 4A and shifting the total voltage to 13.2V and the single cells to 3.37V, but the sun doesnt last long enough, so the voltage stabilizes itself at 3.3V, since there is no load. But no End_of_Charge condition occurs (due to the lack of sun), and therefore there is also no balancing happening.


It is interesting to see, that during the recovery phase the single-cell voltages are not equal, but restart synchronizing, as more they get reloaded again. That is the reason why balancing becomes usually applied only at the end of the charging process, when the cell is full. If in this state there would be a gap between the single cell voltages, than we have the case of a "drift", which damages the cells in the long run and which is the reason that makes balancing a necessary part of a good BMS.

High Voltage Cutoff (HVC) and balancing


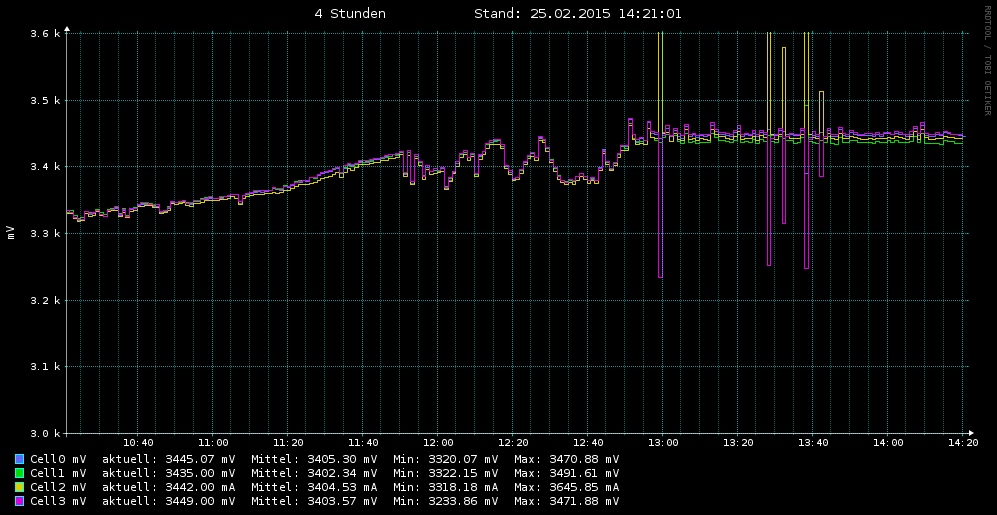
The next day there was much more sun, starting early at 9:00. and then running straight until 11:50. From then to 12:50 the sun was a bit "flickering", but then the battery reached its maximum voltage and the balancing started. Next we see many single events especially in the green and yellow line, which is the battery and load current. This events are related to switching processes during the balancing. At 13:28 there is an event, were the load is partially covered by the sun and partially by the battery, so the amount of load-amps fits exactly the sum of the battery outgoing current plus the incoming current from the sun.


In the single-cell monitoring diagramm one can see a common voltage-level of about 3.45V with little peaks up to 3.48V. These peaks are in reality a little bit higher (like 3.5V which is the maximum per default setting), but not every peak-maximum is fully detected, due to the sampling and update frequency of 1 min. There are also a few very big peaks, which are probably artifacts caused by the switching.